Fontys S3
IT Monitoring
I implemented a Nagios server and installed Ntop as part of my network monitoring system.
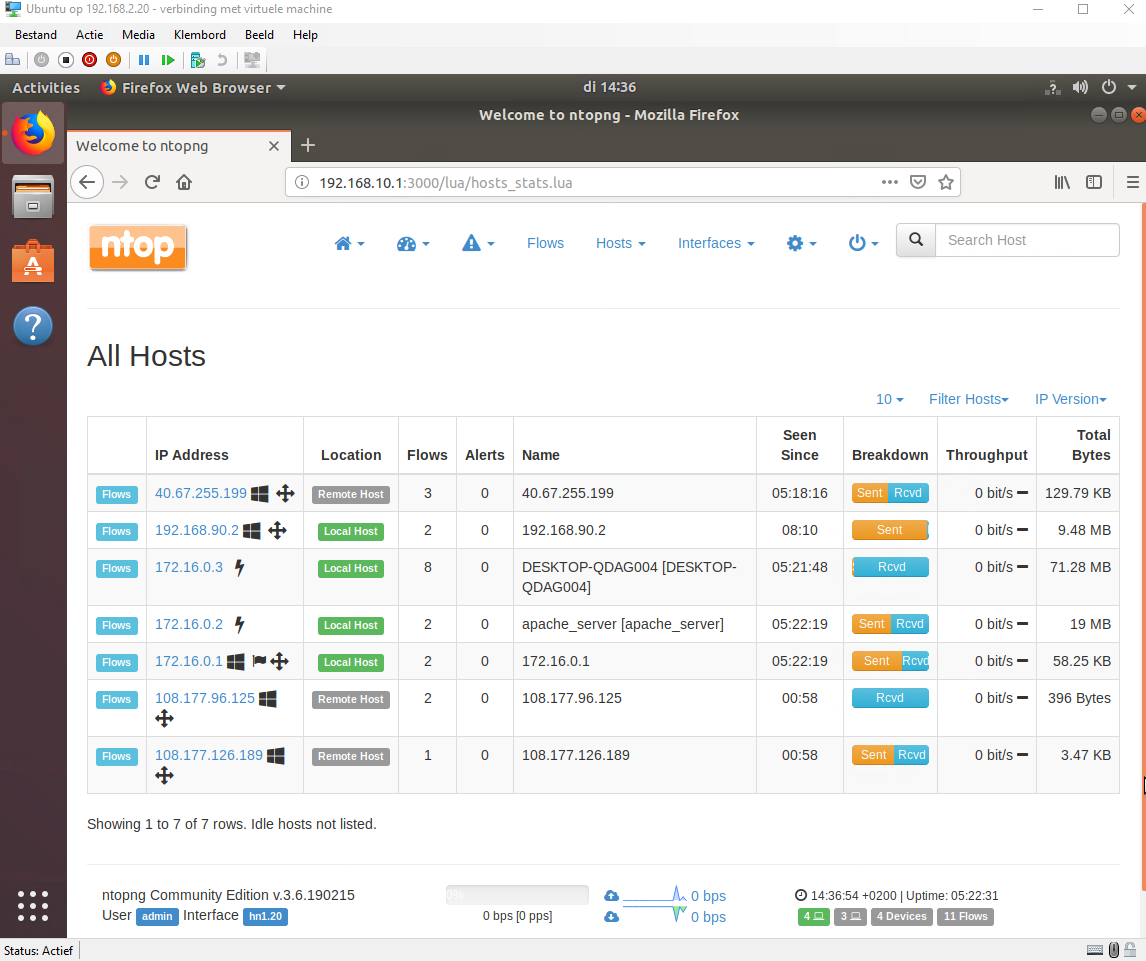
Ntop generates a list with all hosts that are online on the network and you can filter them by VLAN. You can see how much bandwidth they are using how much data was transferred since they are online and how many flows are going to that host.

Here I can see which host uses the most traffic in my DMZ. With 172.16.0.2 being the apache server and 172.16.0.3 being the IIS server.
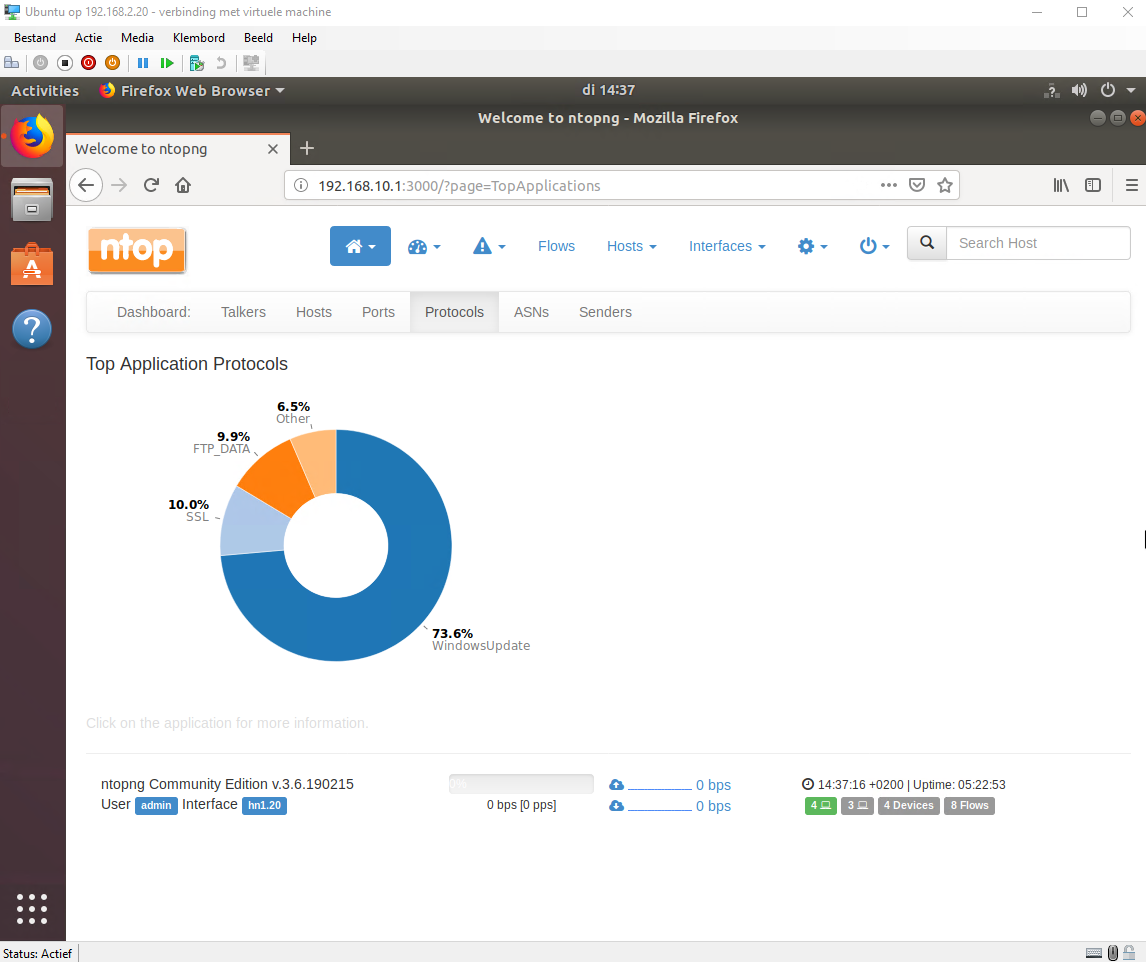
Here I can see which protocols are used the most. Windows update on number 1 because it needs to download a lot and after that ssl for the https traffic to my website and ftp to push changes. This doesn't indicate that the most traffic is going to windows update only that it used the most bandwidth.
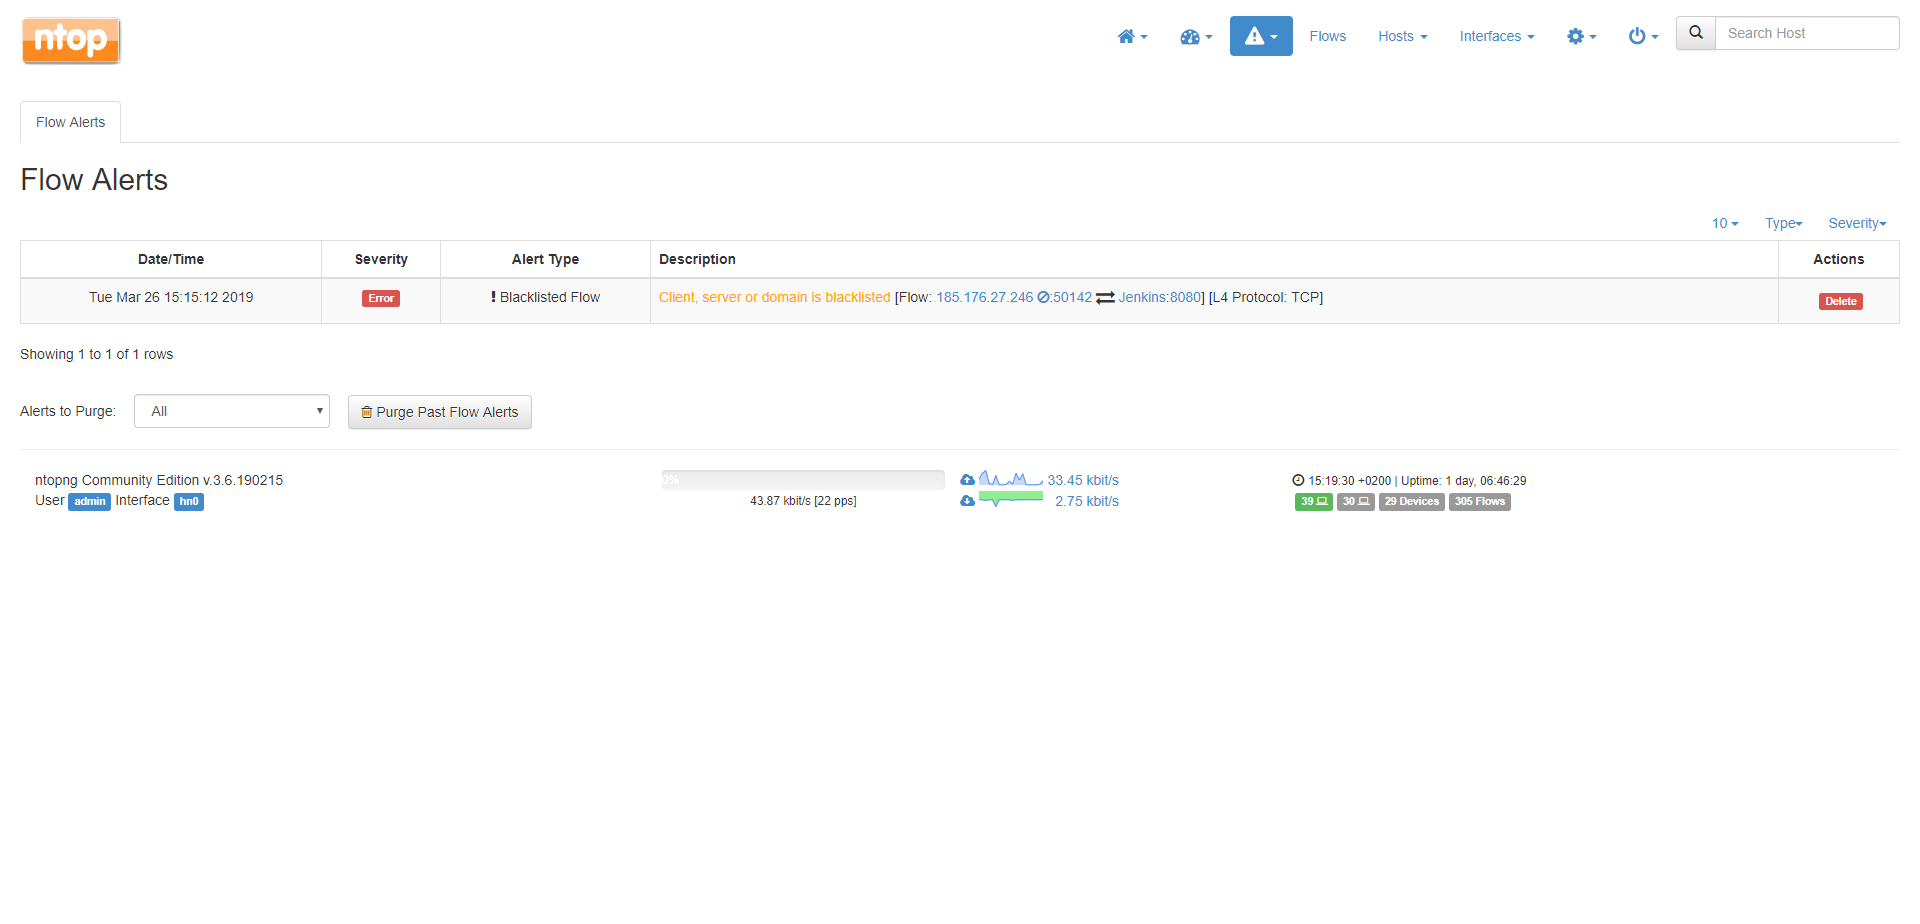
Ntop even managed to identify a rogue Bulgarian hacker trying to access my Jenkins server.
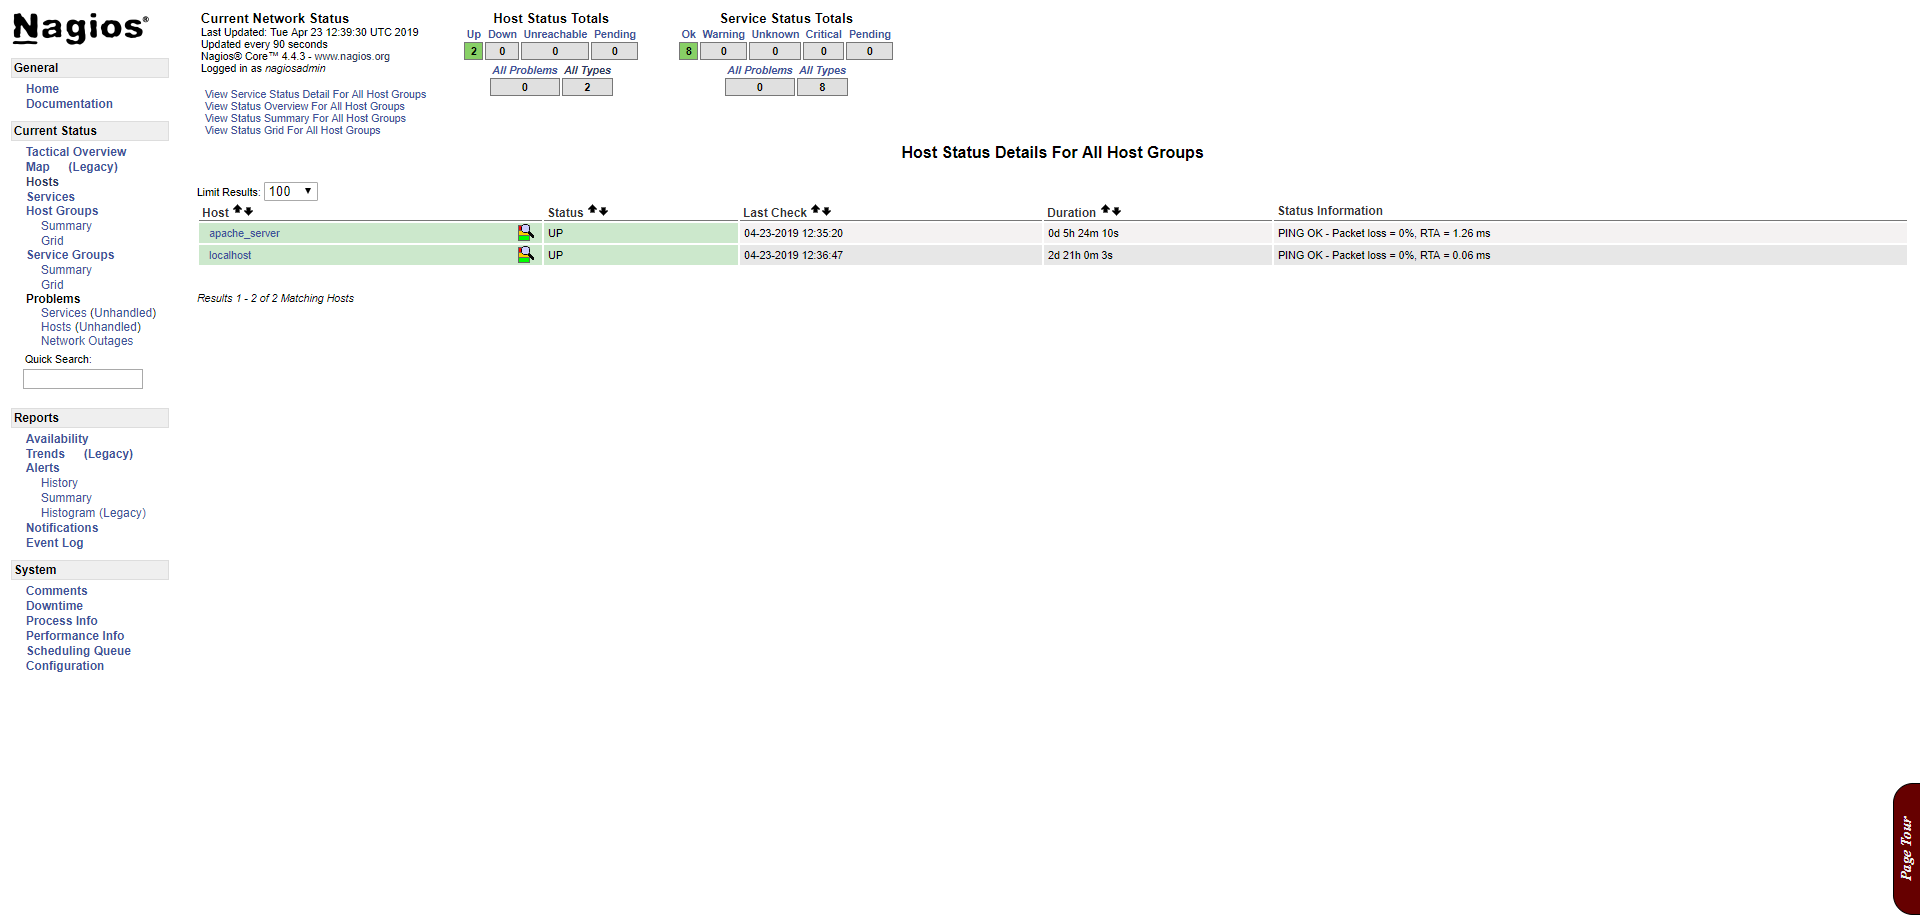
This is Nagios it is in some ways similar to Ntop but is much more advanced and can do some things that Ntop can't. On this page you can see al the hosts that are monitored by Nagios. It displays if the hosts are up and running or if there are any problems.
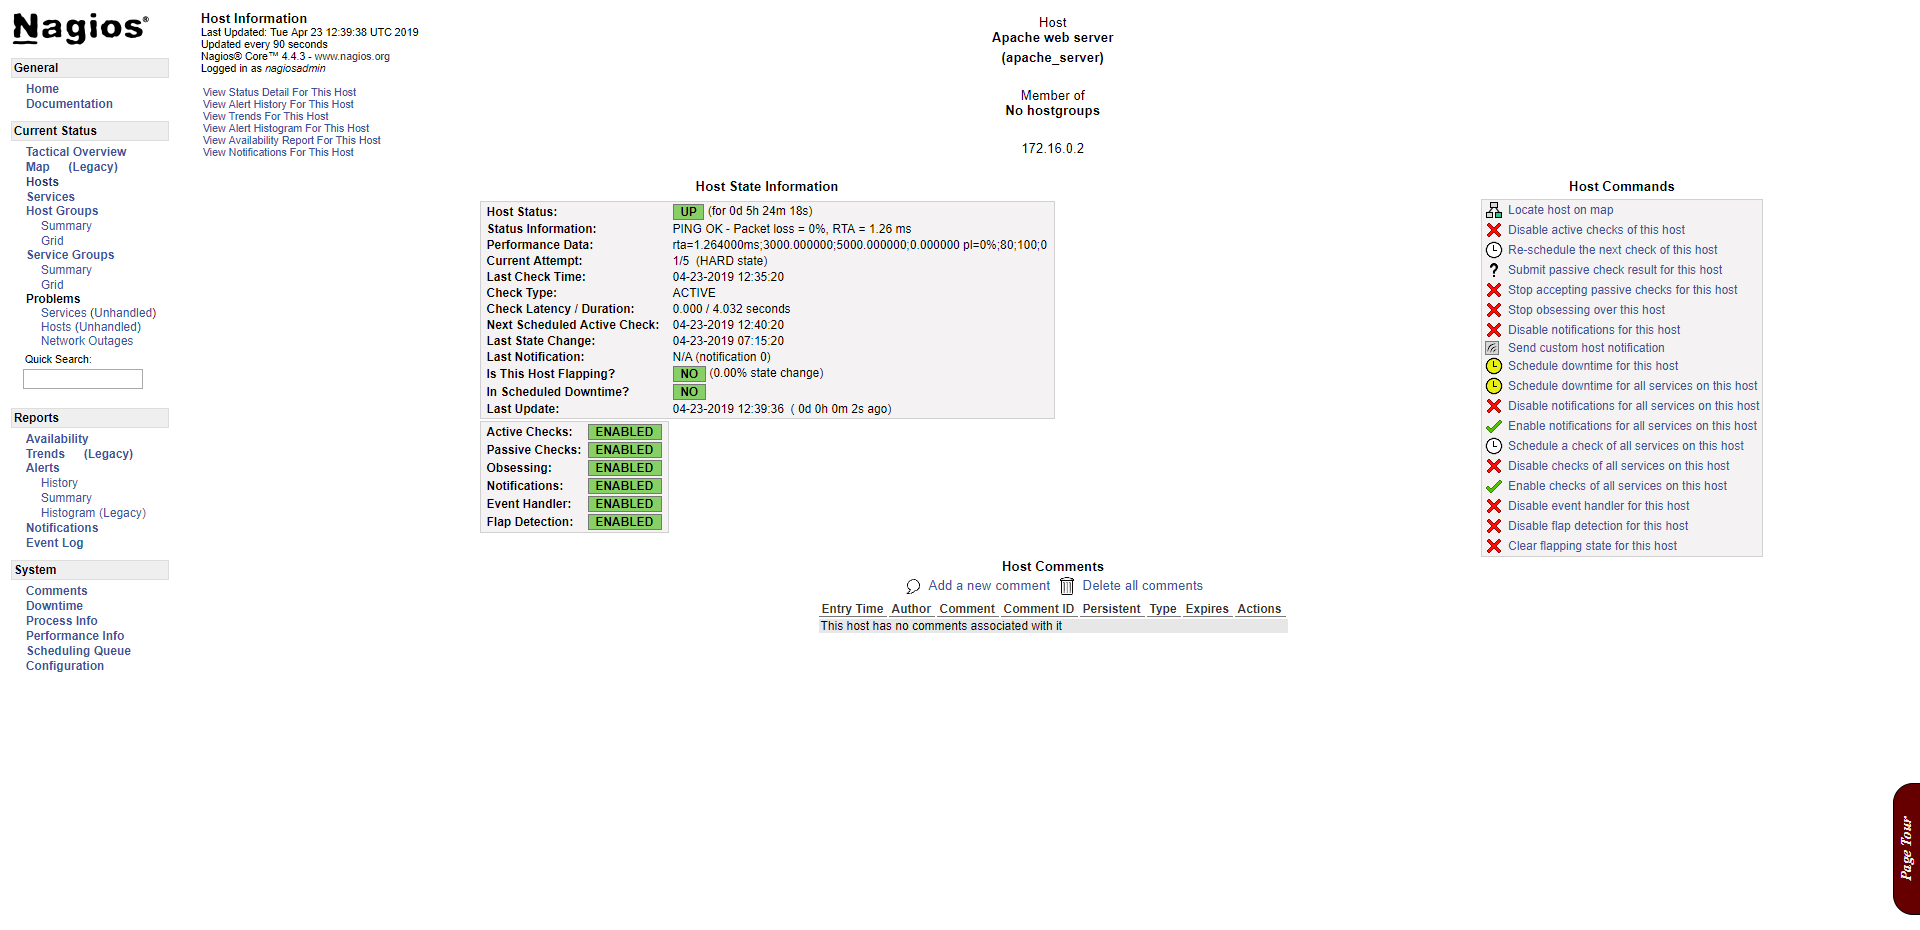
If you click on one of the monitored hosts from the previous picture Nagios will show you with a more detailed report on the host with some more information about uptime and status.
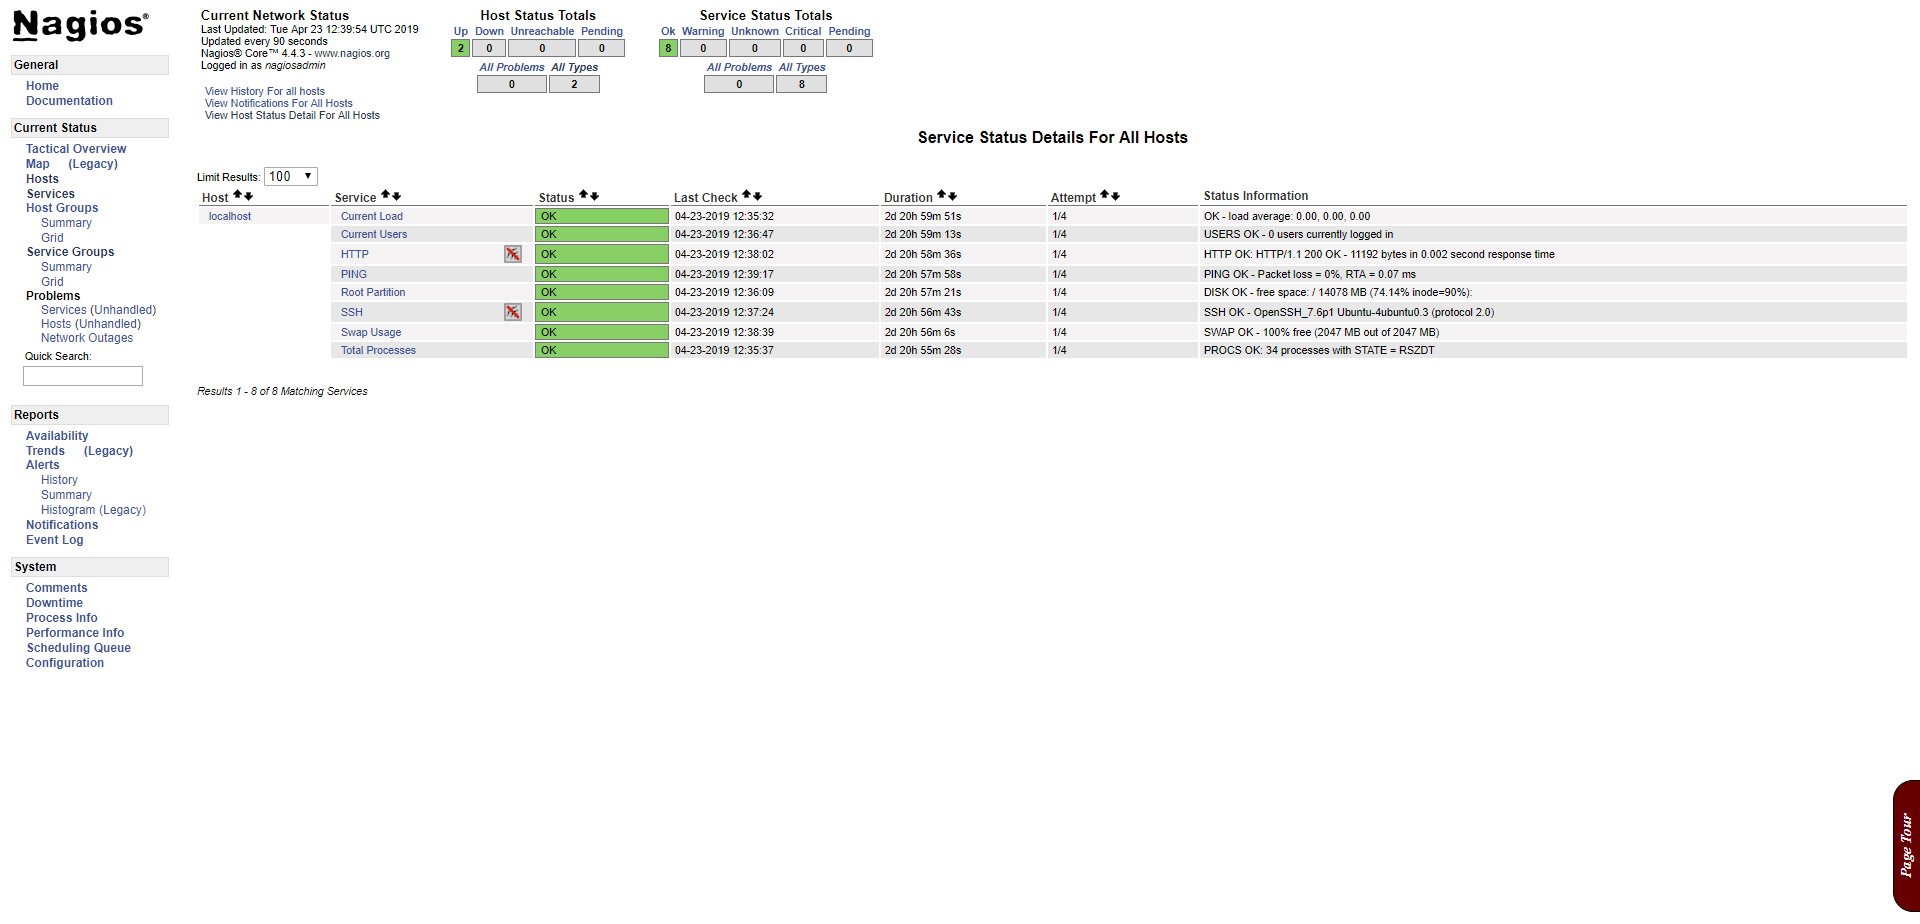
This is a great example on something Nagios is much better at then Ntop. Here Nagios monitors all the services you flagged on different hosts. For example your apache server could be down but the physical Linux server is still up and running. Nagios and Ntop will both say this Linux machine is up and fine but Nagios will also say that the http/https service is down. The same goes for every other service you configure to monitor (SSH/FTP).
- Date: April 2019
- Client: Fontys
- Category: Monitoring